Datalake
The epilot Datalake streams real-time events for entity operations, workflow executions, journey analytics, and portal analytics into a ClickHouse data warehouse. Connect any BI tool to build reports and dashboards.
info
Contact customer support or sales to enable the Datalake for your organization.
Data Schemas
Four datasets are available:
1. Entity Operations Event Streams
Real-time event stream of entity create, update, and delete operations.
{
    "activity_id": "string",  // ID for the individual entity operation/activity
    "entity_id": "string",    // ID of the entity being mutated
    "org_id": "string",       // Organization ID
    "operation": "string",    // Operation can be "createEntity," "updateEntity," or "deleteEntity"
    "schema": "string",       // Schema of the entity
    "timestamp": "DateTime",  // Timestamp of the entity mutation
    "detail": "string",       // Stringified JSON payload containing entity data
}
- operation --
createEntity,updateEntity, ordeleteEntity - timestamp -- when the operation occurred (useful for time-series reports)
- activity_id / entity_id -- identifiers for the operation and affected entity
- detail -- stringified JSON of the full entity state at the time of the operation
tip
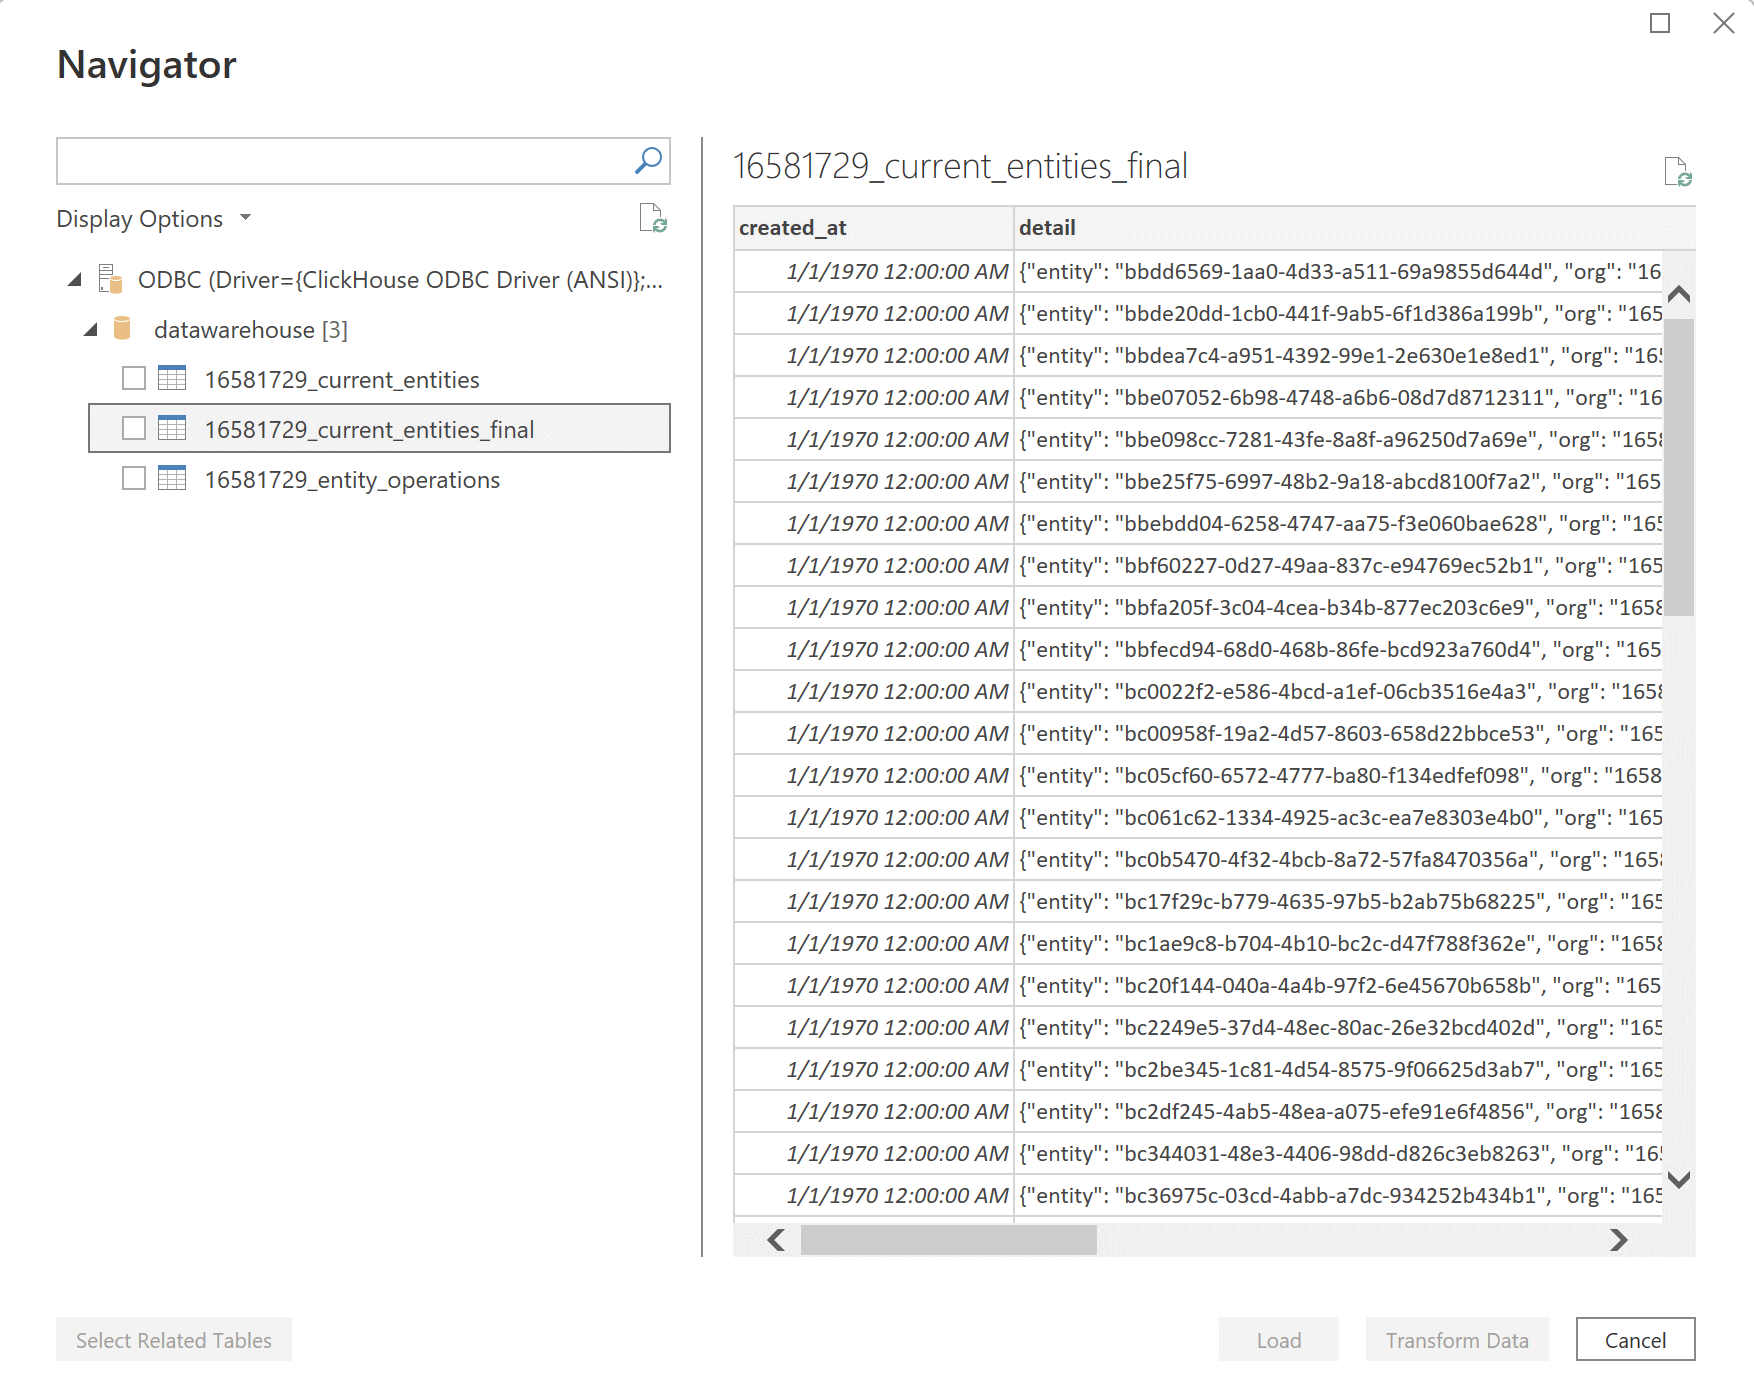
The view {org_id}_current_entities_final shows only the latest state of active (non-deleted) entities, simplifying many common queries.
2. Workflow Execution Snapshots
Real-time snapshots of workflow execution data across five tables:
{org_id}_workflow_executions_final-- workflow execution attributes.{org_id}_workflow_phases_final-- phase attributes for each execution.{org_id}_workflow_tasks_final-- individual step/task attributes.{org_id}_workflow_cancellations_final-- cancellation reasons.{org_id}_workflow_contexts_final-- related entities for each execution.
See the Workflow Execution API reference for full details.
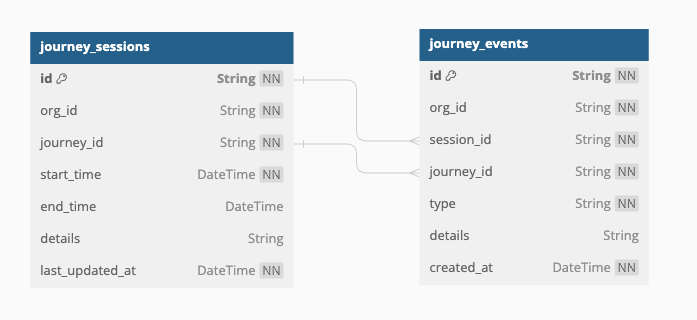
3. Journey Analytics
Tracks user sessions and interactions for each journey.
Journey sessions schema:
{
    "id": "string",  // Unique identifier for the session (UUID)
    "org_id": "string",  // Unique identifier for the organization associated with the session (UUID)
    "journey_id": "string",  // Unique identifier for the user journey to which the session belongs (UUID)
    "start_time": "datetime",  // Timestamp indicating when the session started
    "details": "string",  // Additional details about the session, in JSON format
    "end_time": "datetime",  // Timestamp indicating when the session ended
    "last_updated_at": "datetime", // Timestamp indicating when was the session last updated at
}
The details field is a JSON string containing browser session metadata: deviceType, osType, browserTypeAndVersion, screenResolution, viewportSize, colorDepth, languagePreference, ip, embeddedIn, and isLauncherJourney.
Journey events schema:
{
    "id": "string",  // Unique identifier for the event (UUID)
    "org_id": "string",  // Identifier of the organization associated with the event
    "session_id": "string",  // Unique identifier for the session in which the event occurred (UUID)
    "journey_id": "string",  // Unique identifier for the user journey to which the event belongs (UUID)
    "type": "string",  // Type of event (e.g., "step_navigation", "journey_submit", "journey_exit")
    "details": "string",  // Additional details about the event, typically in JSON format
    "created_at": "datetime"  // Timestamp indicating when the event was recorded
}
Event types (type field):
| Type | Description |
|---|---|
journey_load_time | Time for the journey to load (API response time). |
step_navigation | User navigated between steps. |
journey_submit | User completed and submitted the journey. |
journey_exit | User closed or refreshed the journey tab. |
The details field carries event-specific data: fromStepName/fromStepNumber/toStepName/toStepNumber for navigation events, stepNumber/stepName for exit events, and load duration for load-time events.
Tables:
{org_id}_journey_sessions_final-- journey session data.{org_id}_journey_events_final-- journey event data.
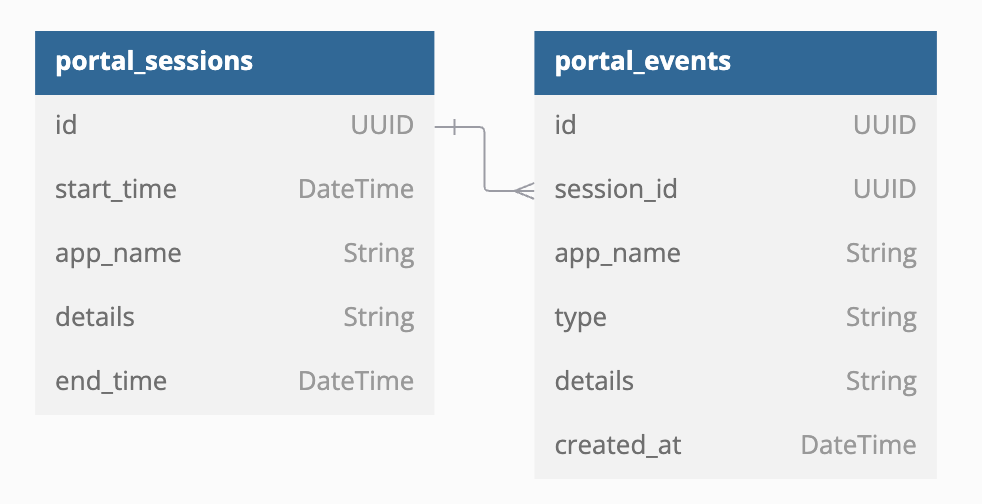
4. Portal Analytics
Tracks user sessions and interactions for the customer portal and installer portal.
Portal sessions schema:
{
    "id": "string",  // Unique identifier for the session (UUID)
    "org_id": "string",  // Identifier of the organization associated with the event
    "app_name": "string", // Name of the app for which the session was created (customer portal, installer portal etc.)
    "start_time": "datetime",  // Timestamp indicating when the session started
    "details": "string",  // Additional details about the session, in JSON format
    "end_time": "datetime",  // Timestamp indicating when the session ended
    "last_updated_at": "datetime", // Timestamp indicating when was the session last updated at
}
The details field is a JSON string containing: deviceType, osType, browserTypeAndVersion, screenResolution, viewportSize, colorDepth, languagePreference, ip, email, domainName, and referrer.
Portal events schema:
{
    "id": "string",  // Unique identifier for the event (UUID)
    "org_id": "string",  // Identifier of the organization associated with the event
    "session_id": "string",  // Unique identifier for the session in which the event occurred (UUID)
    "app_name": "string", // Name of the app for which the event was created (customer portal, installer portal etc.)
    "type": "string",  // Type of event (e.g., "user_logged_in", "page_navigation", etc.)
    "details": "string",  // Additional details about the event, in JSON format
    "created_at": "datetime"  // Timestamp indicating when the event was recorded
}
Portal event types
| Type | Description |
|---|---|
user_logged_in | User logged in. |
user_registered | New user registered. |
user_logged_out | User logged out. |
user_account_deleted | User account deleted. |
user_email_changed | User updated email address. |
password_changed | User changed password. |
page_navigation | User navigated between pages. |
add_contract_initiated | User started adding a contract. |
contract_added | Contract added. |
contract_viewed | User viewed a contract. |
contracts_listing_viewed | User viewed contract list. |
contract_due_date_changed | User changed contract due date. |
contract_payment_rate_changed | User changed payment rate. |
order_viewed | User viewed an order. |
orders_listing_viewed | User viewed order list. |
order_accepted | User accepted an order. |
order_refused | User declined an order. |
opportunity_viewed | User viewed an opportunity. |
opportunities_listing_viewed | User viewed opportunity list. |
document_uploaded | User uploaded a document. |
document_downloaded | User downloaded a document. |
document_deleted | User deleted a document. |
documents_listing_viewed | User viewed document list. |
all_documents_downloaded | User downloaded all documents in a section. |
meter_viewed | User viewed a meter. |
meters_listing_viewed | User viewed meter list. |
meter_widget_viewed | User viewed a meter widget. |
meter_reading_submission_initiated | User started submitting a meter reading. |
meter_reading_submitted | Meter reading submitted. |
journey_opened | User opened a journey. |
journey_closed | User closed a journey. |
additional_info_update_initiated | User started updating custom info. |
additional_info_updated | Custom info updated. |
additional_info_viewed | User viewed custom info. |
payments_listing_viewed | User viewed payment list. |
product_viewed | User viewed a product. |
teaser_opened | User opened a teaser. |
external_website_opened | User navigated to an external site. |
The details field carries event-specific context: page URLs for navigation, entity details for contracts/orders/meters, external links, and custom information updates.
Tables:
{org_id}_portal_sessions_final-- portal session data.{org_id}_portal_events_final-- portal event data.
Setting Up the Datalake
Generate credentials
Go to Settings > Data Lake in the epilot portal.
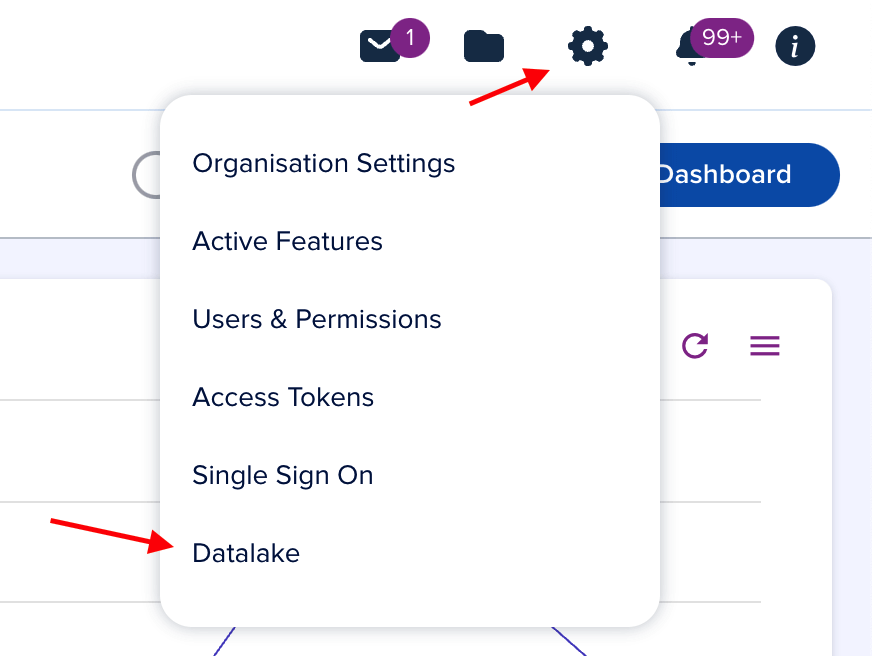
The Data Lake page lists active credentials. You can revoke existing credentials or create new ones.
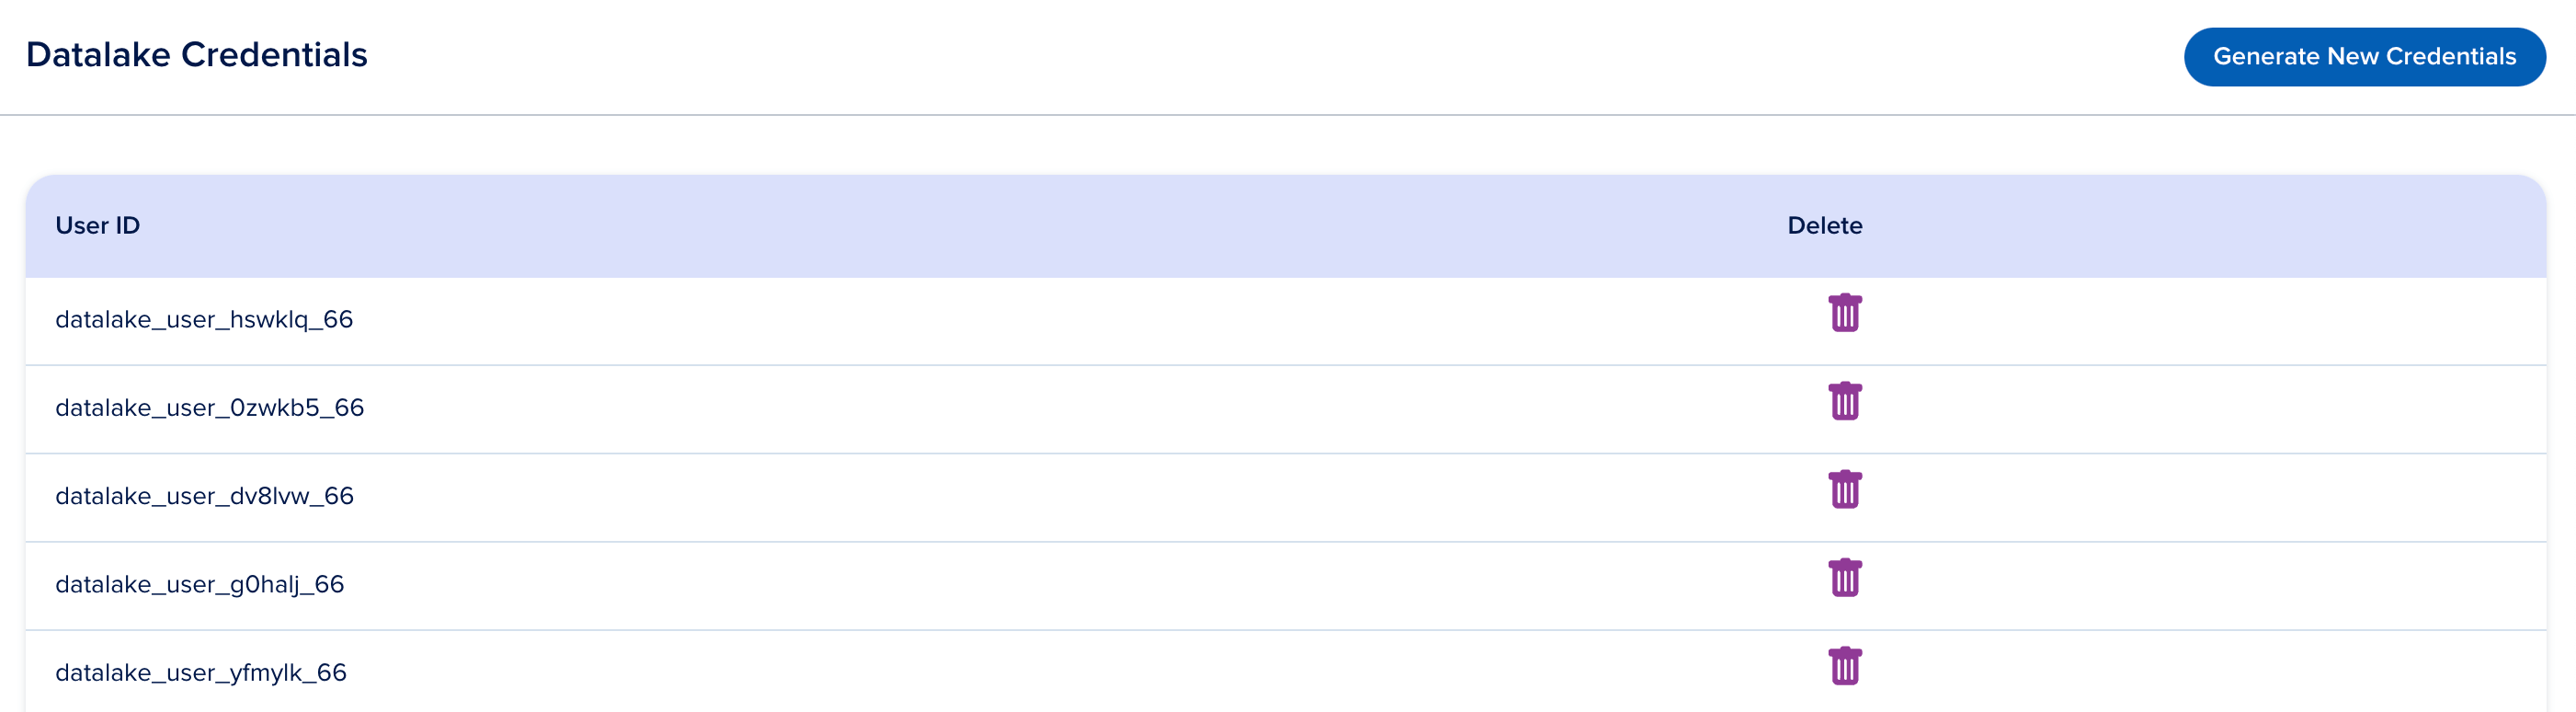
Click Generate Credentials.
Save the password immediately -- it is shown only once.
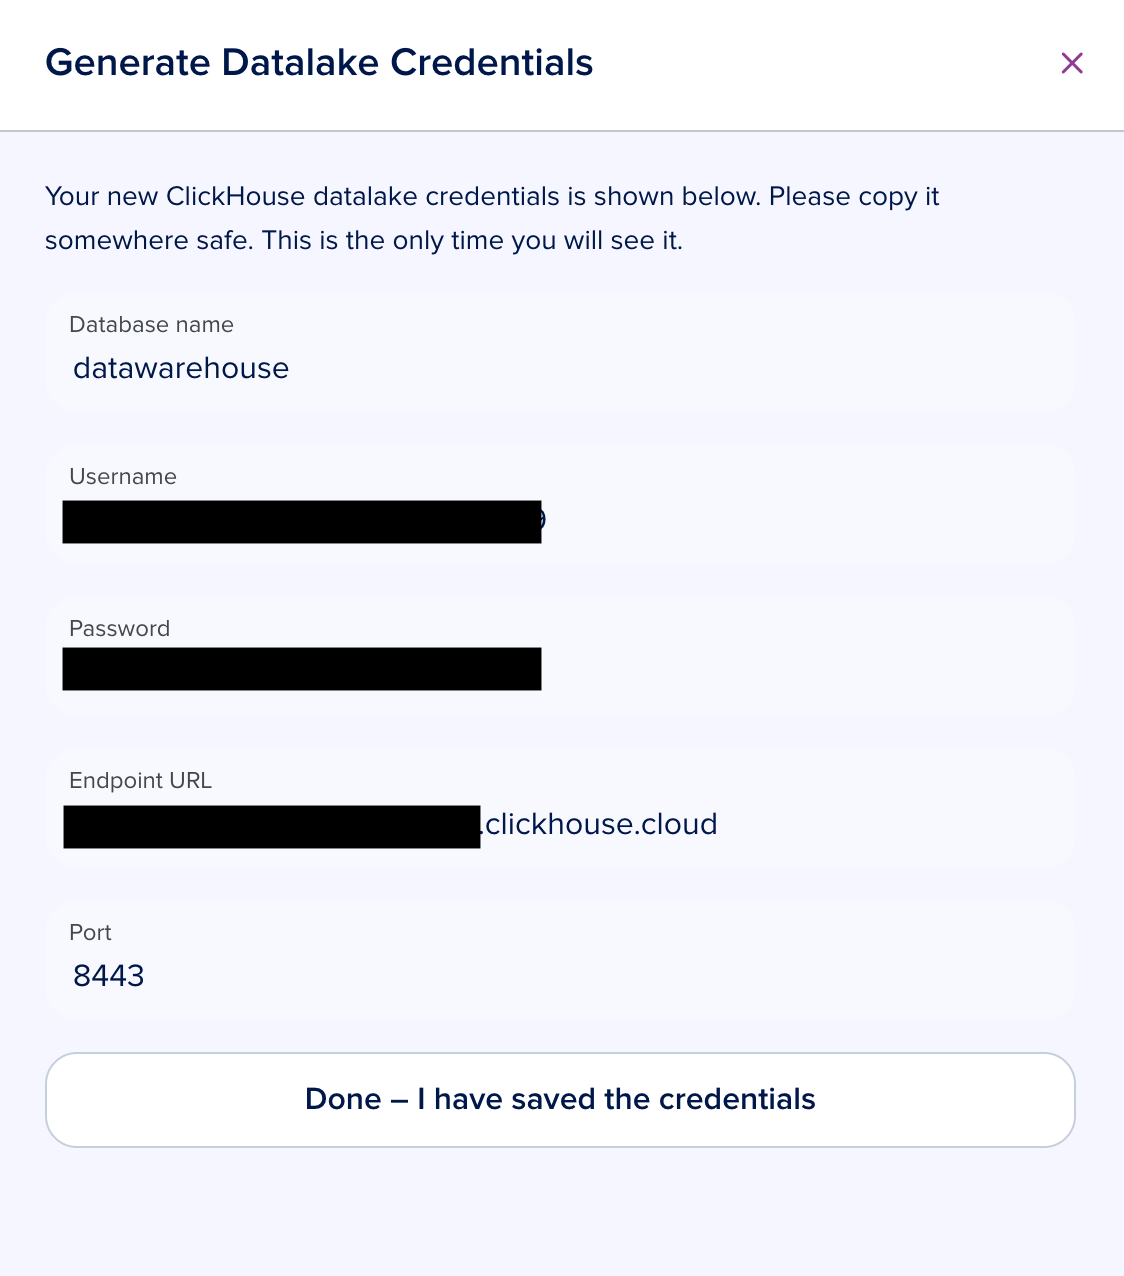
Use the
username,host,port,database, andpasswordto connect from any BI tool or SQL client.
Querying the Data
Connect to ClickHouse and query your data using either approach:
Direct SQL queries
Write SQL queries against the ClickHouse tables.
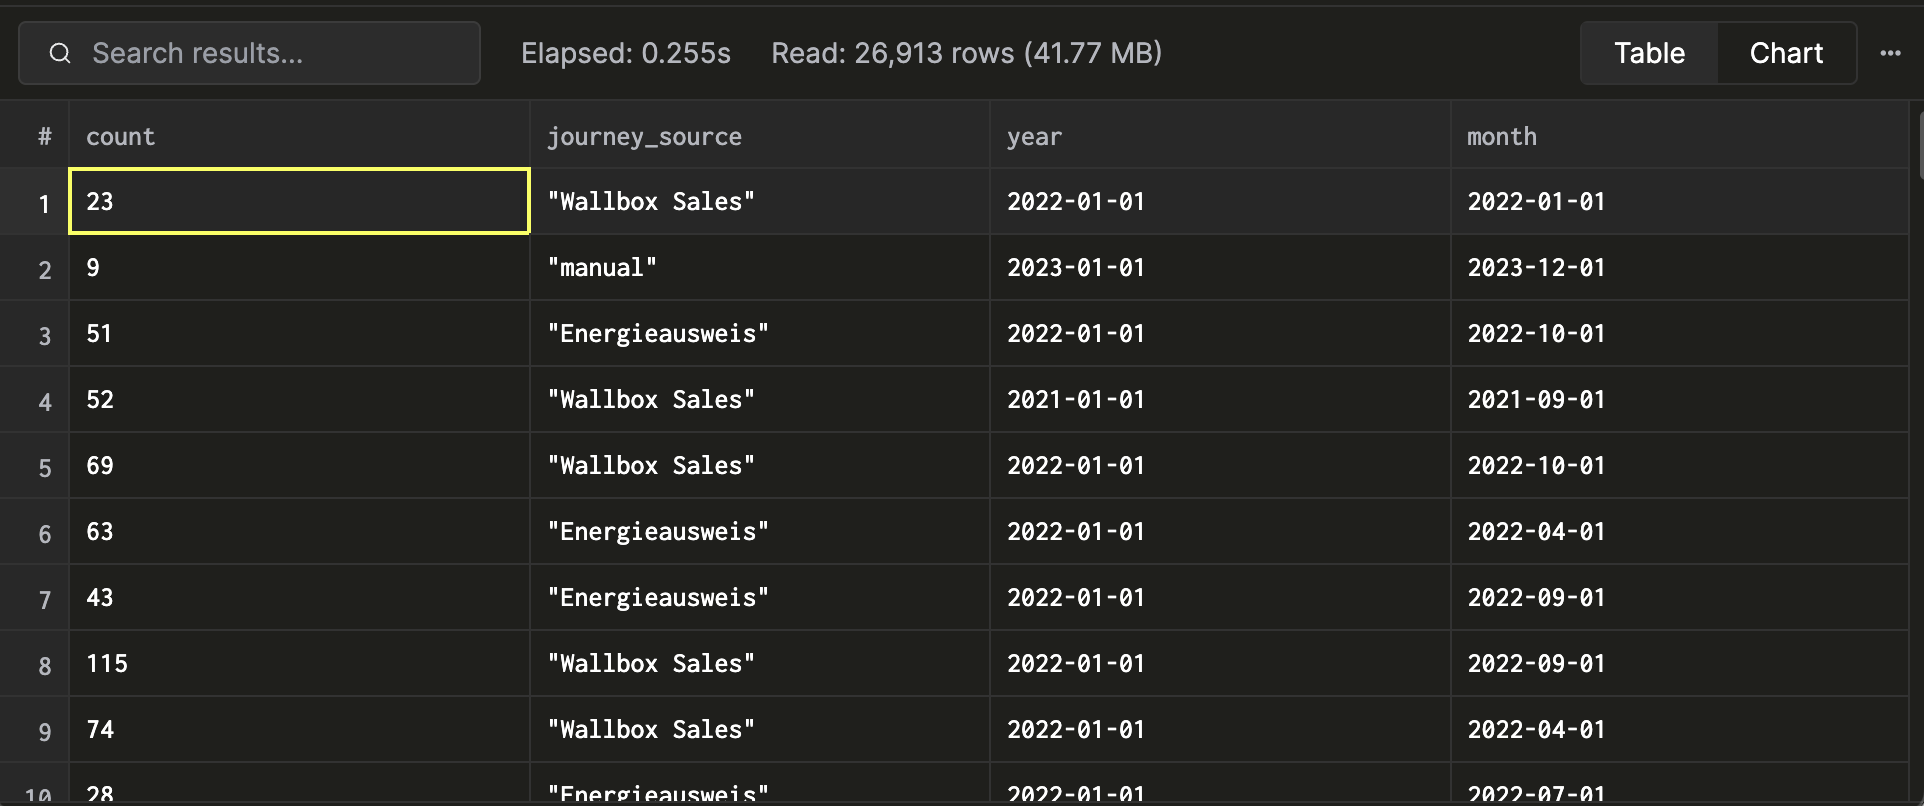
Example 1: Opportunities created over time
SELECT
    count(*) AS count,
    JSONExtractString(detail, 'payload', 'source', 'title') AS journey_source,
    toStartOfYear(timestamp) AS year,
    toStartOfMonth(timestamp) AS month
FROM entity_operations
WHERE schema = 'opportunity'
  AND operation = 'createEntity'
GROUP BY journey_source, year, month;
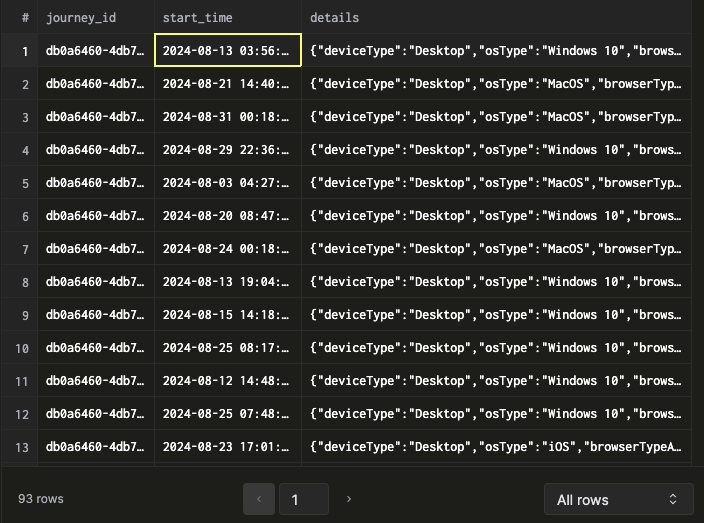
Example 2: Journey sessions over time
SELECT journey_id, start_time, details
FROM {org_id}_journey_sessions_final
WHERE journey_id = {your_journey_id}
  AND start_time > '2024-08-01 00:00:00';
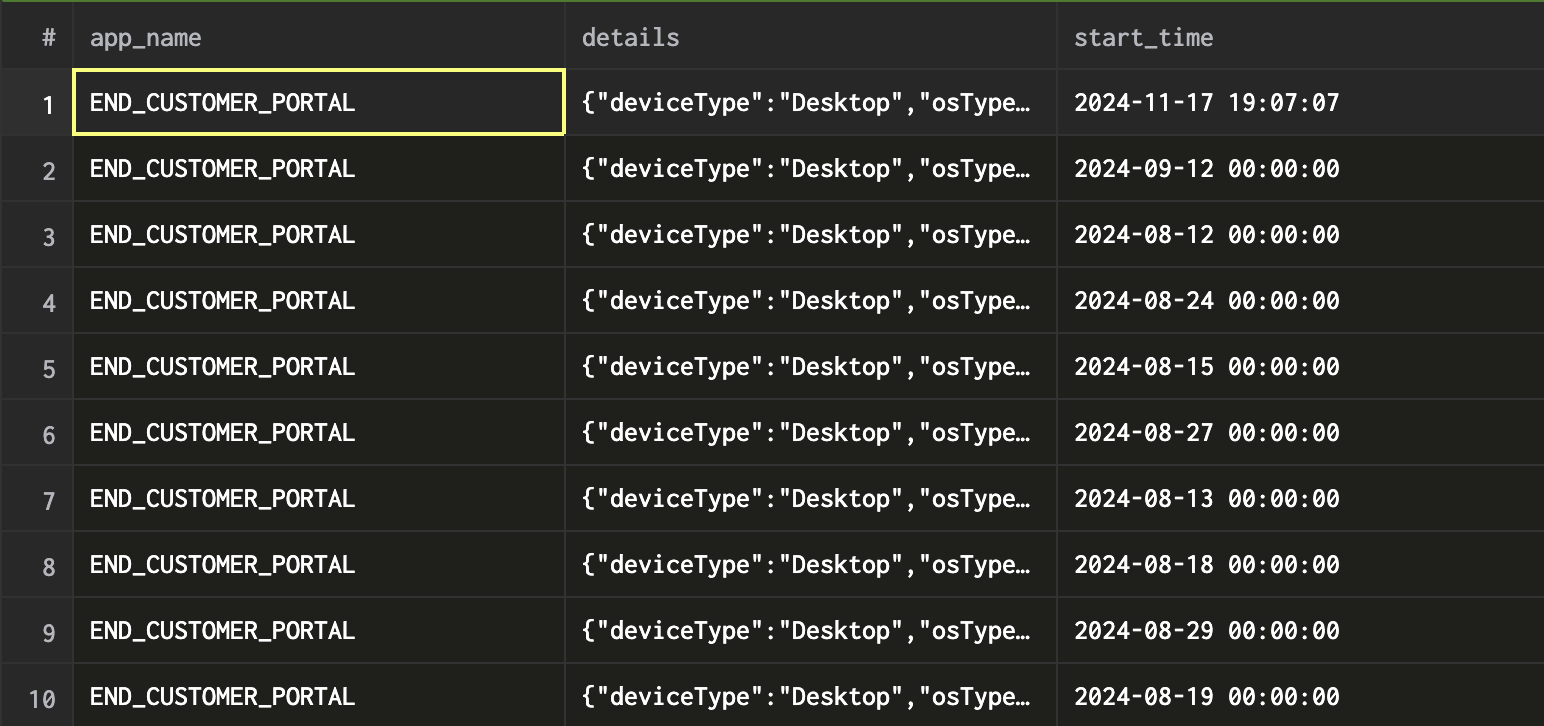
Example 3: Portal sessions over time
SELECT app_name, start_time, details
FROM {org_id}_portal_sessions_final
WHERE app_name = {your_app_name}
  AND start_time > '2024-08-01 00:00:00';
Use any SQL client that supports ClickHouse. See the DataGrip integration guide for a walkthrough.
Connecting to BI tools
Connect your preferred BI tool directly to ClickHouse, or use the official ClickHouse ODBC driver.
info
The walkthrough below demonstrates connecting Power BI for an energy utility company reporting on Wallbox and Energieausweis sales journeys.
See ClickHouse + Power BI integration for connection options.
Steps to create a Power BI report:
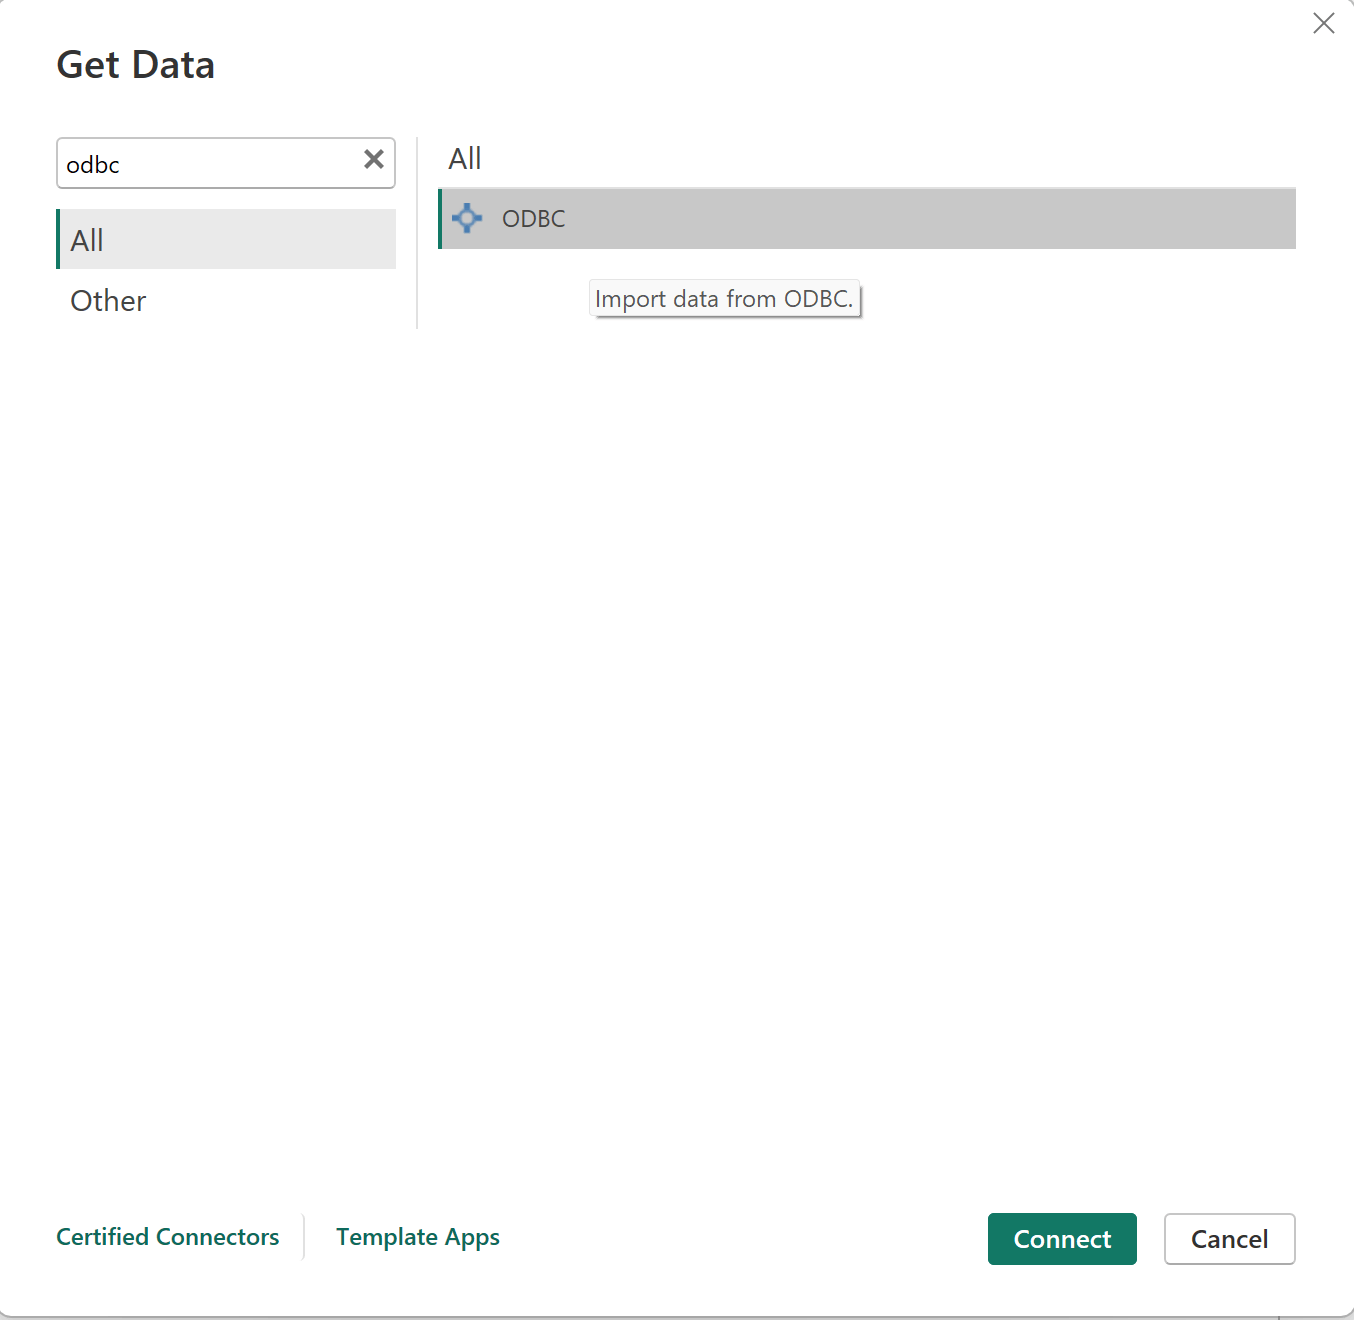
Add data source -- Install the ODBC driver, then add a new ODBC data source in Power BI.
Enter connection details -- Provide the ODBC connection string, username, password, and database.
Driver={ClickHouse ODBC Driver (ANSI)};Server={host};Port=8443;Database=datawarehouse;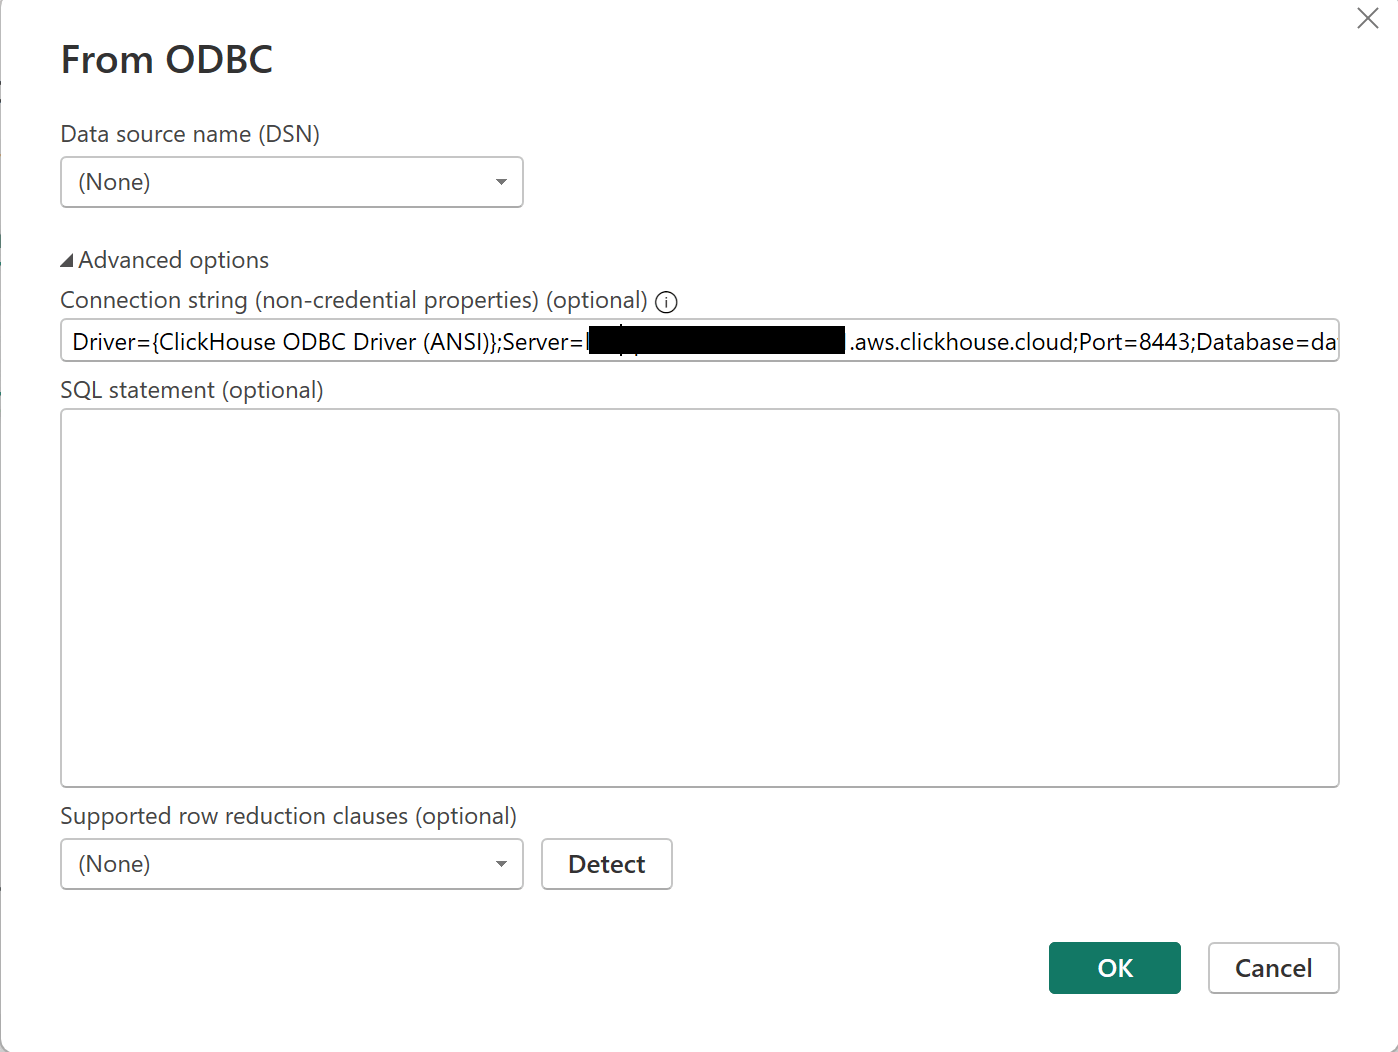
Select data -- Browse schemas and tables. Look for
entity_operationsand the{org_id}_current_entities_finalview.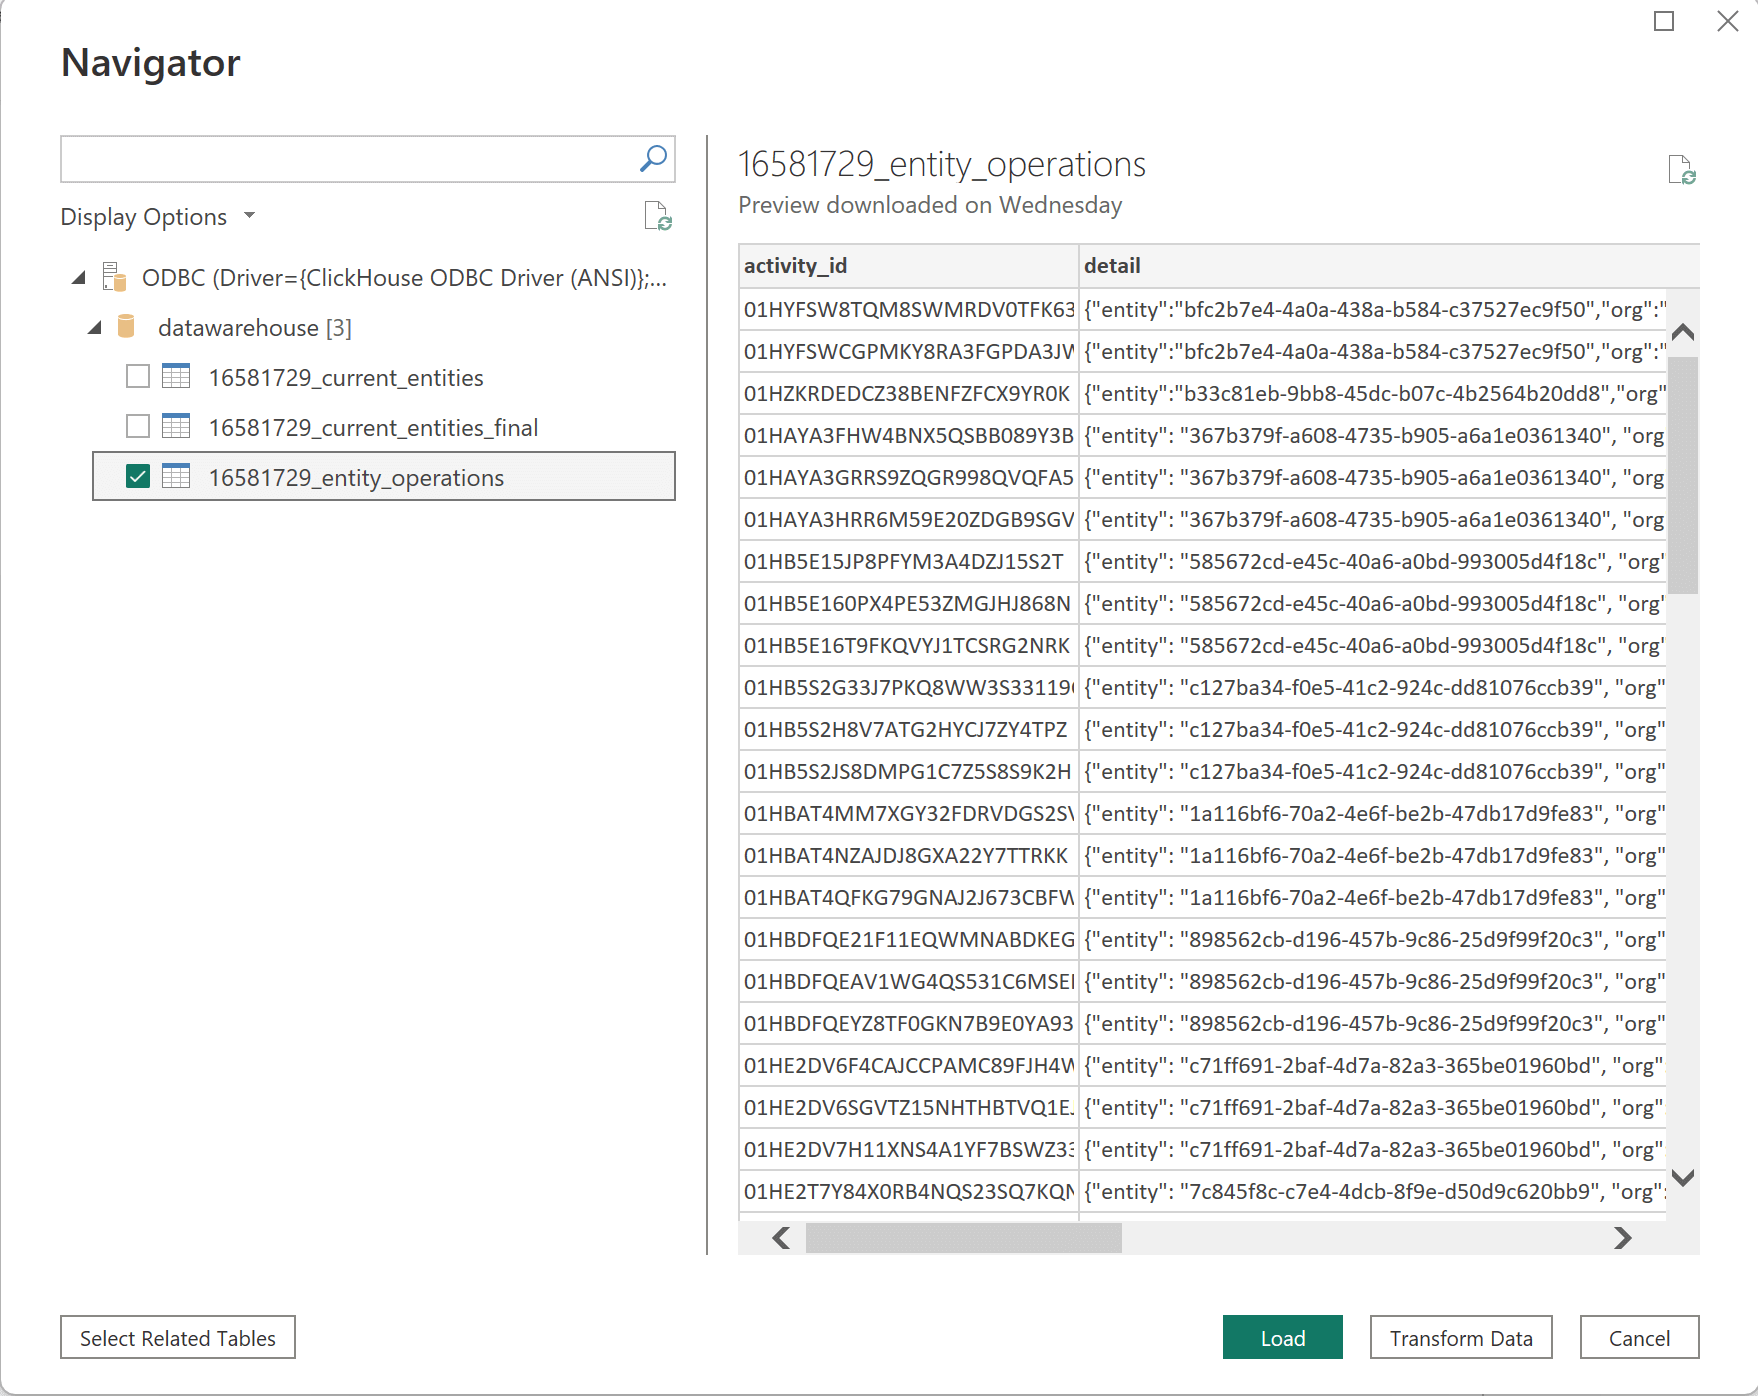
Load or transform -- Click Load Data for raw import, or Transform to preprocess data in Power BI's query editor.
Model data -- Create relationships between tables (e.g. entity operations and workflow data).
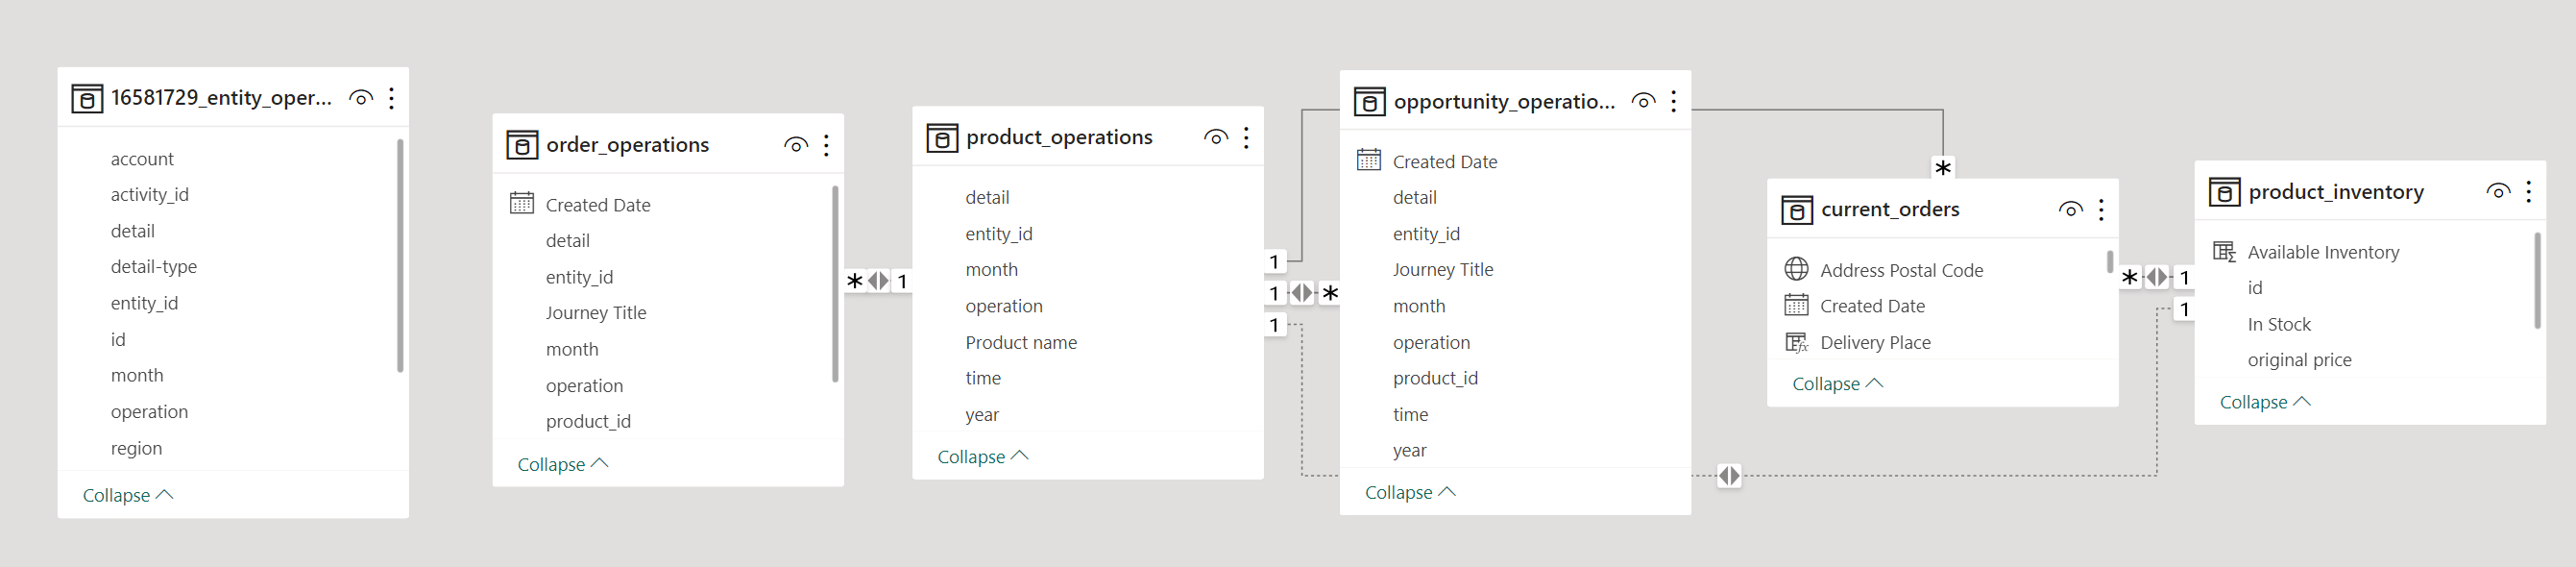
Build reports -- Use charts, tables, and visuals to present insights.
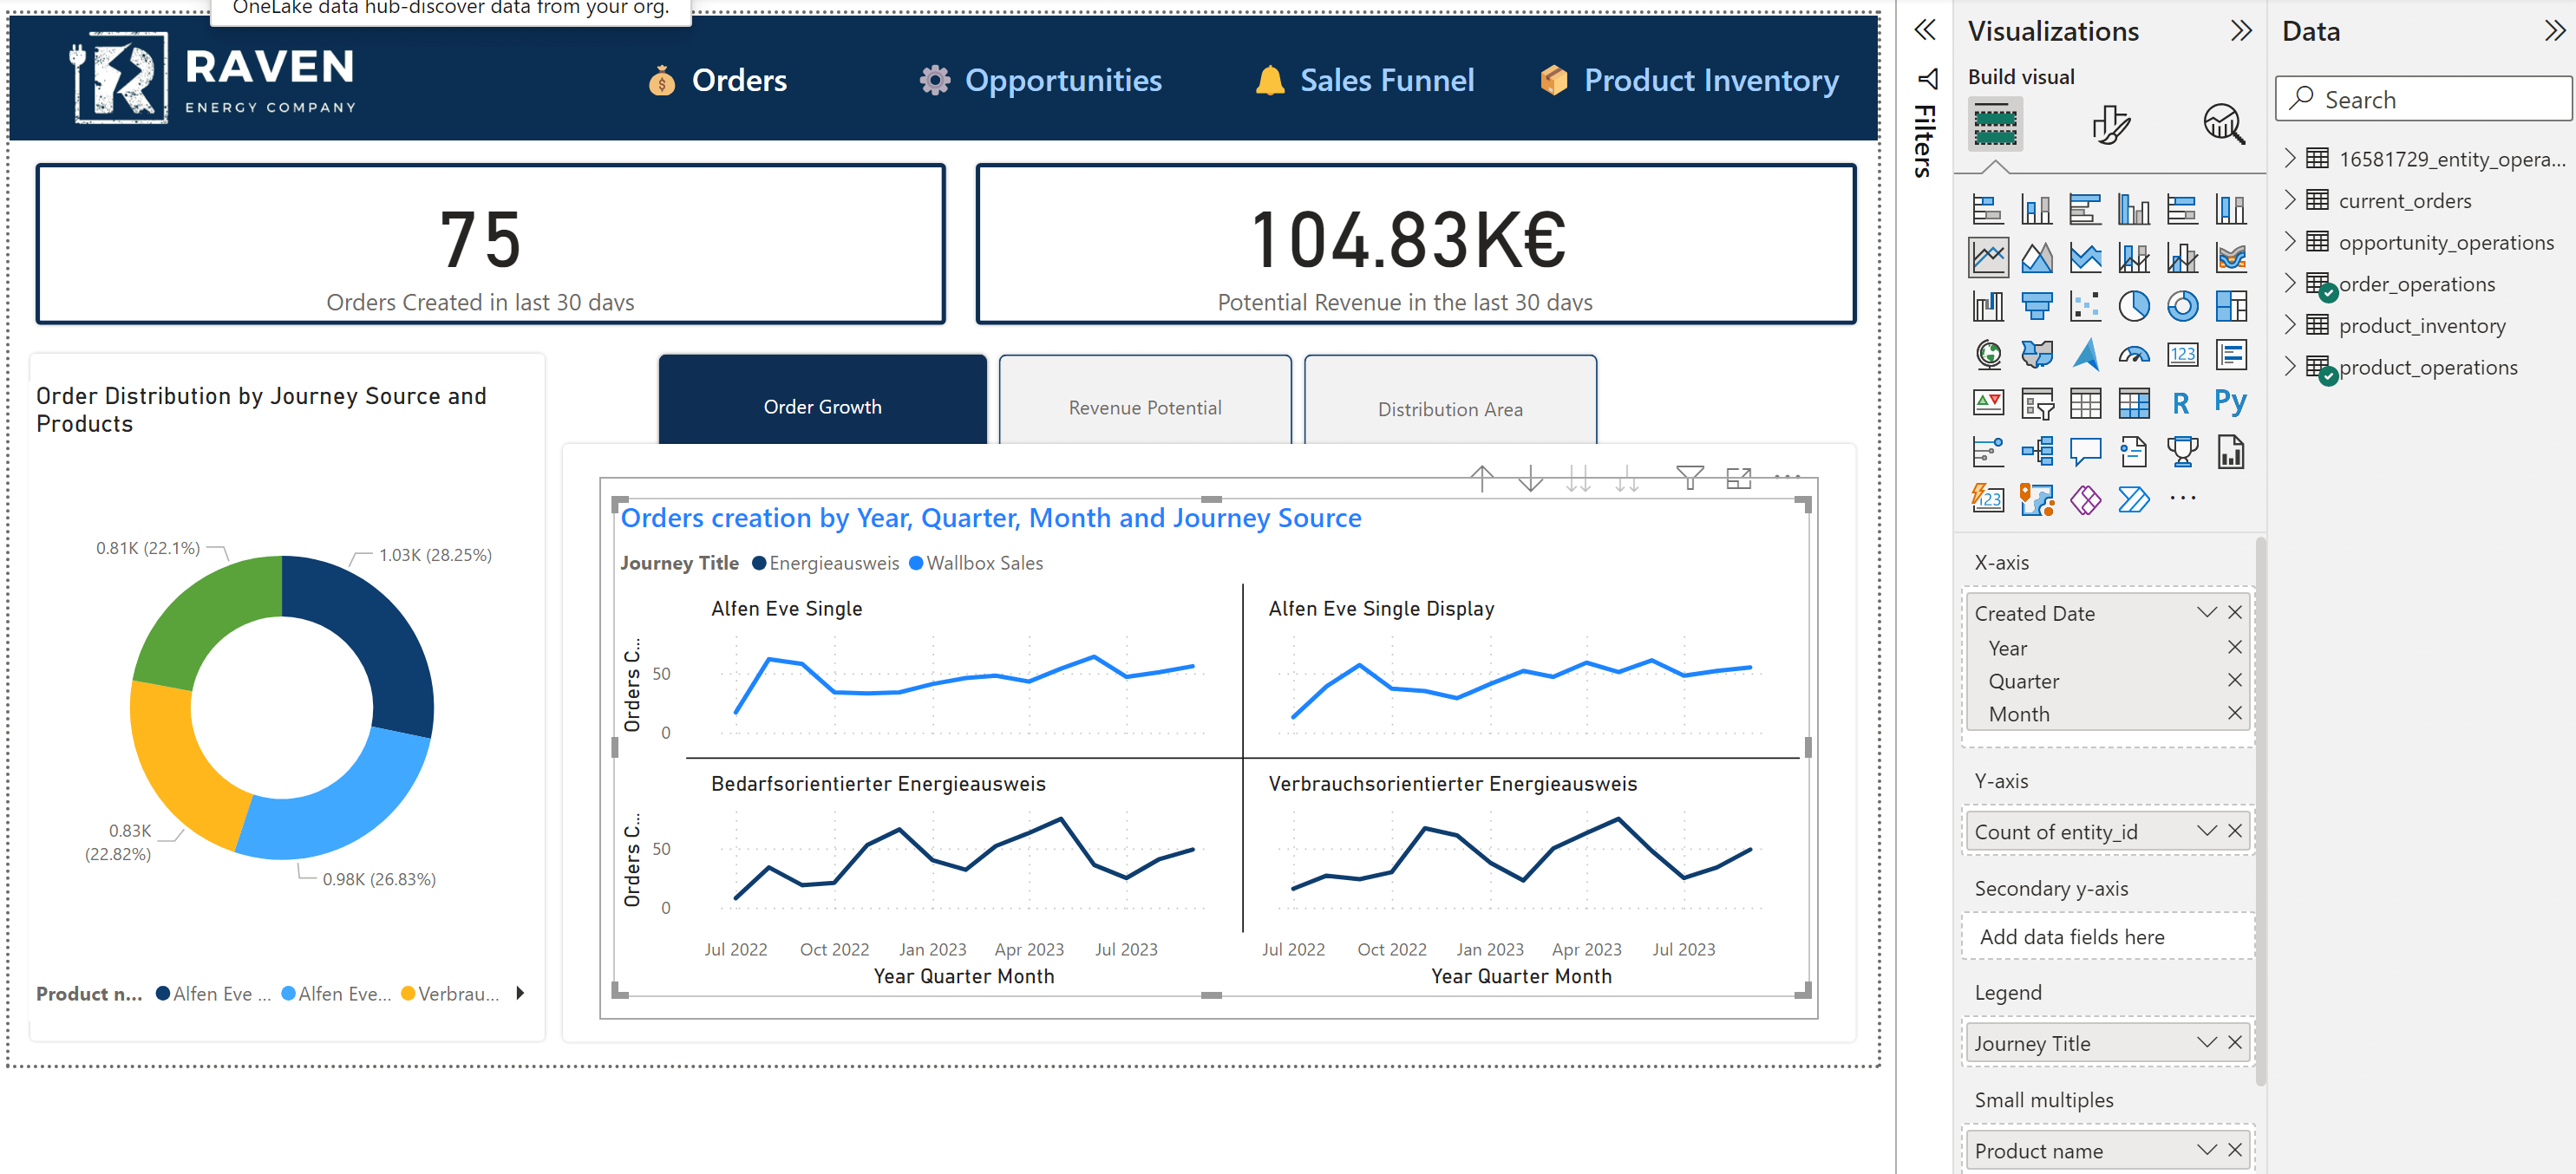
Interactive Power BI Report: Entity Operations
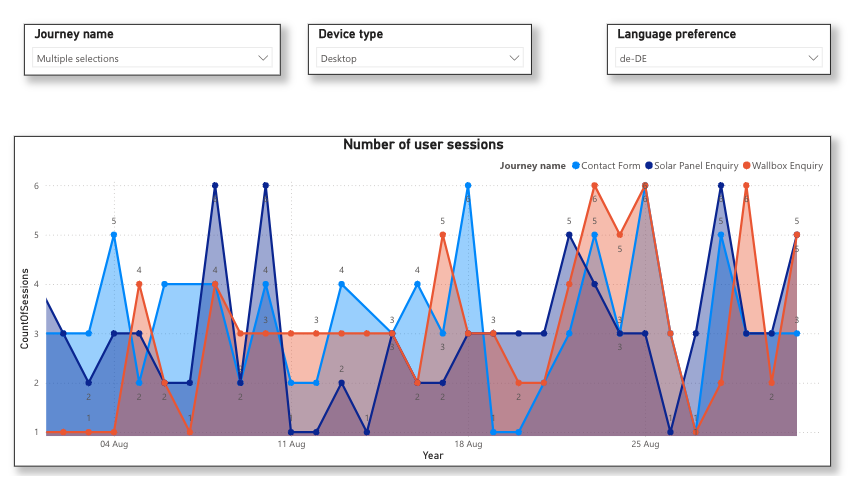
Interactive Power BI Report: Journey Analytics
See ClickHouse data visualization integrations for connecting other BI tools.